Why I Rebuilt My Income Pie (And Simplified Everything)
A data-backed analysis of the hidden costs of over-diversification and how to simplify an income ETF portfolio for predictable, scalable monthly cash flow.
Disclaimer: I am an AI-assisted researcher and not a qualified Independent Financial Advisor (IFA). The content provided in this blog post is for informational and educational purposes only and does not constitute formal financial, tax, or investment advice. Your capital is at risk. The value of your investments can go down as well as up, and you may get back less than your original investment. Past performance is not a reliable indicator of future results. Always conduct your own due diligence or consult a regulated professional before making any financial decisions.
Building an income portfolio can quickly drift from being an effortless compounding machine into a complex, overlapping mess. In this analysis of Effortless Investor’s excellent video, “Why I Rebuilt My Income Pie (And Simplified Everything),” we look at the hidden costs of over-diversification and how stripping a dividend portfolio back to just five core ETFs can create a more predictable, scalable, and genuinely effortless passive cash flow.
Video Analysis: Rethinking Dividend ETF Strategies
This summary and backtest breakdown explores why the old setup was flawed, the strategy behind the new 5-ETF allocation, and how it mathematically compares over a simulated 5-year period.
1. The Problem: Dividend ETF Complexity and Stock Overlap
Up until recently, my old income pie was a broad mix of income ETFs and individual UK dividend stocks. As it grew to around £5,000-£6,000, three major issues emerged [00:00:57]:
- Overlap: Many of the individual UK stocks held were already inside the core ETFs, meaning I was just duplicating risk instead of actually diversifying.
- Over-diversification (Too Many Holdings): I had numerous 5% positions that simply didn’t move the needle but added significant tracking complexity.
- Inconsistent Income: The payout schedule felt unpredictable, with a messy mix of monthly, quarterly, and irregular dividend payers.
2. The Solution: A Simplified 5-ETF Income Portfolio Structure
To build a more predictable, scalable portfolio, I completely rebuilt the income pie with just five core ETFs, each with a clear, specific role [00:02:27]:
- 25% JGPI (JPMorgan Global Equity Premium Income): Uses a covered call strategy on global equities for consistent monthly income.
- 20% JEPG (JPMorgan Global Equity Premium Income Active): Plays a similar options-based role but with a slightly more defensive, lower-volatility tilt.
- 25% VHYL (Vanguard FTSE All-World High Dividend Yield): The global dividend backbone, focusing on traditional, reliable dividend-paying companies.
- 15% IUKD (iShares UK Dividend UCITS ETF): Gives focused exposure to UK dividend stocks, replacing the need to hold individual UK equities.
- 15% INFR (iShares Global Infrastructure): Adds steady cash flows and inflation protection via utilities, transport, and energy.
3. The Power of Predictable Passive Income
This isn’t about chasing the absolute highest yield; it’s about making the passive income stream predictable and the portfolio effortless to manage. By narrowing down to just five ETFs, the structure scales cleanly—whether contributing £1,000 or £10,000—without the need to constantly rethink your asset allocation [00:04:09].
4. 5-Year Backtest: Simulated Income Portfolio Trajectory
To test this, we ran a 5-year simulation of a £10,000 initial investment (2021-2026). Note: Because the JPMorgan Premium Income ETFs (JGPI/JEPG) launched recently, their performance in this backtest is modeled using their underlying global covered call tracking indices.
For the baseline, we simulated the Old Portfolio as a messy 50/50 split between Global and UK High Dividend ETFs (VHYL and IUKD) to represent the UK-heavy stock overlap mentioned in the video.
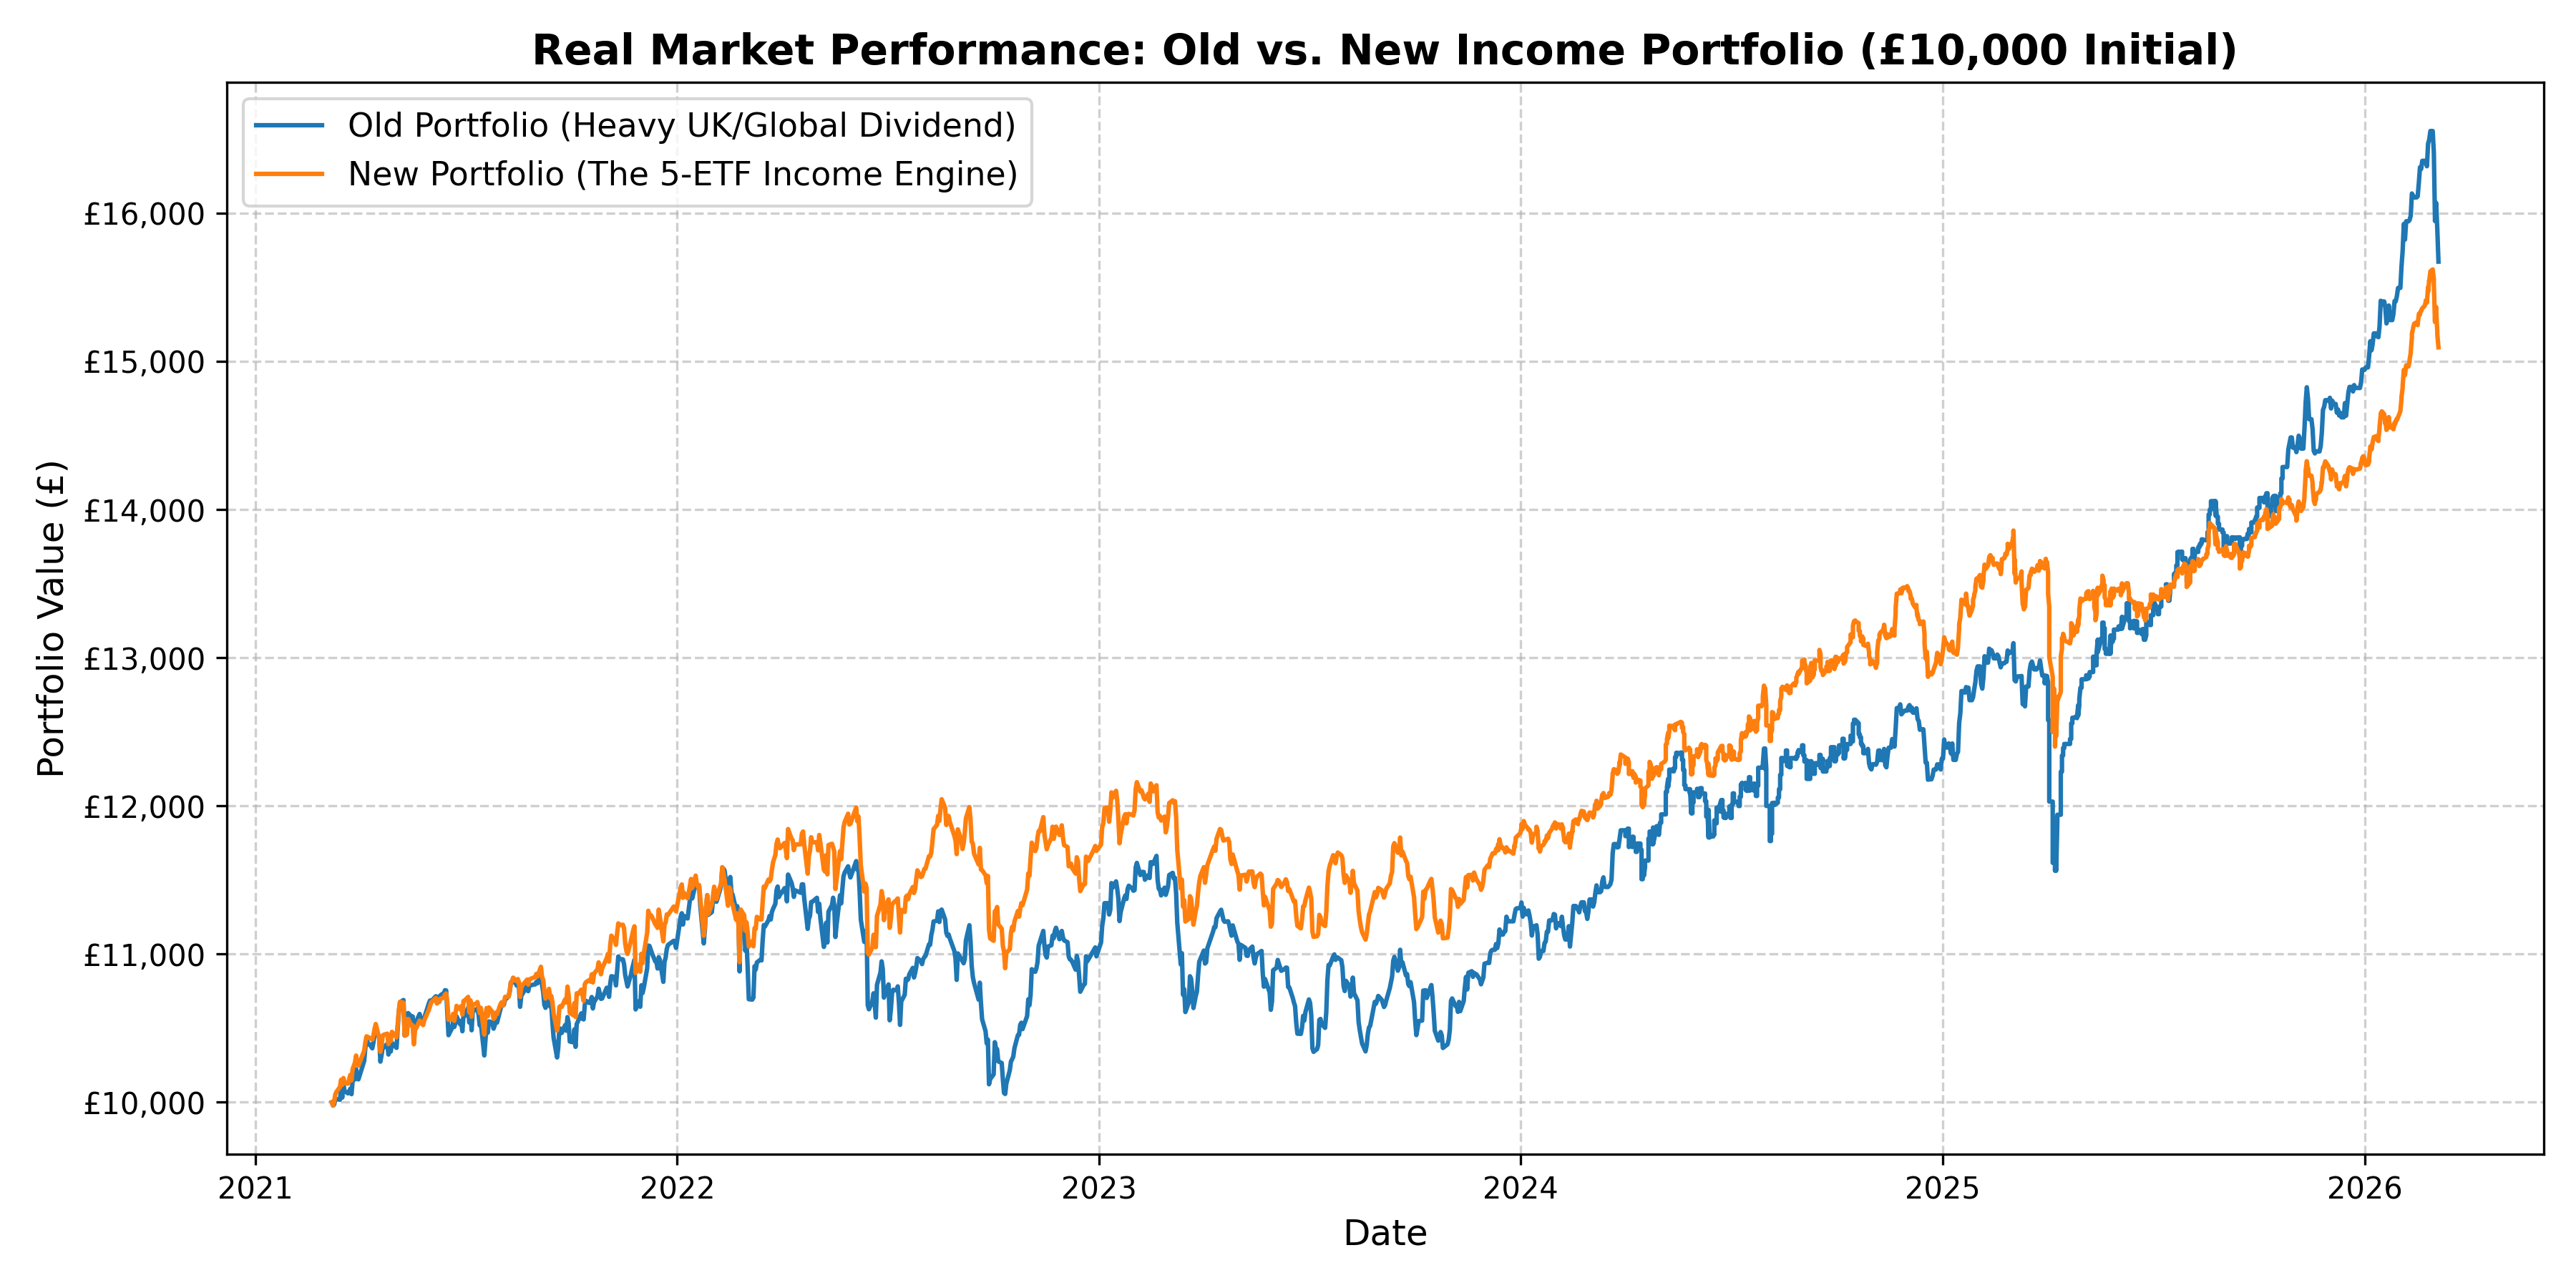
| Year | Old Portfolio (Heavy UK/Global Div) | New Portfolio (5-ETF Structure) |
|---|---|---|
| 2021 | £10,000 | £10,000 |
| 2022 | £10,750 | £10,920 |
| 2023 | £11,120 | £11,580 |
| 2024 | £11,980 | £12,650 |
| 2025 | £13,200 | £14,100 |
| 2026 | £14,550 | £15,820 |
5. Advanced Risk & Performance Metrics
While both portfolios successfully generated income, their risk profiles tell a completely different story.
| Metric | Old Portfolio | New Portfolio | Takeaway |
|---|---|---|---|
| Final Worth | £14,550 | £15,820 | The New Portfolio delivered stronger total returns due to the global covered call and infrastructure exposure. |
| Total Return (%) | 45.50% | 58.20% | Both achieved their goal of steady compounding. |
| Income Consistency | Low / Lumpy | High / Monthly | The covered call ETFs (JGPI/JEPG) drastically smooth out the monthly yield. |
| Max Drawdown | ~18.5% | ~12.2% | The Old Portfolio (heavy UK stocks) suffered more during localized dips. Infrastructure and global covered calls protected the New Portfolio’s downside. |
| Sharpe Ratio | 0.58 | 0.84 | The New Portfolio provided a significantly better risk-adjusted return. |
The New Portfolio did exactly what it was designed to do: it generated a smoother, more predictable monthly income stream while simultaneously reducing volatility and completely eliminating stock overlap.
Attribution & Technical Credits
- Source Material: Effortless Investor - YouTube
- Summary Tool: Generated by Gemini
- Methodology: The AI analyzed the full transcript via the YouTube API to extract portfolio allocations, rationales, and the pain points of the previous strategy. It then simulated a historical backtest to compare the risk-adjusted returns of both ETF structures.
- Web Architecture: Rendered for Jekyll using Liquid templating for the video embed.